1. Introduction
The European Union (EU) wine industry is currently producing more than 50% of the world’s total wine output. Two of its characteristics are particularly striking: it is more regulated than the wine industries in other parts of the world where a lot of wine is also produced (Meloni & Swinnen, 2013; Meloni et al., 2019), and cooperatives are far more powerful than in those other places (Simpson, 2000; Fernández & Simpson, 2017).
In 2021 the cooperatives in Italy, France, Spain, and Portugal claimed to be making half of the EU’s wine1. In Italy, France and Spain, the three world’s biggest wine producers, they would have market shares of around 60, 50 and 70%, which means that Spanish cooperative wineries alone make a volume of wine similar to that produced by all types of wineries in the United States, the world’s fourth largest wine-producing country. But the wine made by cooperatives not only has a reputation for being mediocre, but “we often observe that a wine produced and marketed by a cooperative sells for less than a bottle of comparable quality from a private (non-cooperative) winery” (Schamel, 2014: 1).
This article has three objectives. First, it aims to document the cause-and-effect relationship between the strict regulation of the European wine market and the strong development of cooperatives. This is something that several previous studies on wine cooperation had already pointed out (Chevet, 2008; Fernández, 2012; Medina, 2016; Medina & Planas, 2020; Planas & Medina, 2022), but without paying much attention to the issue, with Fernández and Simpson (2017) as the main exception; meanwhile, cooperatives have hardly been mentioned in the literature on the regulation of the European wine market (Warner, 1960: Barthe, 1966; Spahni, 1988; Gaeta & Corsinovi, 2014; Meloni & Swinnen, 2013; Meloni et al., 2019). Second, it looks at the impact the presence of cooperatives has had on the quality of European wine. Third, it seeks to show that the image that wine economists (Delmastro, 2005; Pennerstorfer & Weiss, 2013; Roma, Martino & Perrone, 2013; Hanf & Schweickert, 2014; Schamel, 2014, 2015; Santos & Schamel, 2018) tend to have of the institutional functioning of cooperative wineries is inexact.
Although I will often refer to other countries, I will mainly use data from Spain, especially from the period under Franco’s regime (1939-75). The reason why I give this prominence to the Spanish case is simply that, due to the availability of sources, I was able to collect far more information on that country than on France or Italy. In almost all European wine-producing countries, the bulk of the governmental provisions that allowed wine cooperatives to take off were adopted shortly after the Second World War. To understand why cooperative wineries are so strong in the EU today, it is therefore essential to perform a detailed analysis of what happened during those years –hence my interest in the Franco period.
The fact that consumers and wine economists alike tend to perceive the quality of wine from cooperatives as poor leads to the apparent contradiction that most European wine comes from companies with a bad reputation2. According to a widely held view among wine economists, cooperatives are very often unable to prevent members (in other words, cooperative owners) from engaging in free-rider behavior when handing their grape harvest over to them. Bijman et al. (2012: 48) summarized the effects of this as follows:
“Wine cooperatives often act as the ‘last resort buyer’[…] Members sell their top quality grapes to investor-owned wineries and supply the cooperative with whatever is left. This practice leads to low quality wines that suffer in the marketplace and ruin the cooperative brand name.”
But such conclusions are not usually based on field studies conducted to check whether the members of a particular cooperative actually behave in this way. Typically, wine economists advocating such reasoning first find –using econometric procedures– that the wines of cooperatives tend to sell at relatively low prices. They then deduce that this is because cooperatives produce poor wines due to their inability to prevent members from adopting free-rider behavior, which, coming full circle, would be a “confirmation of economic theory predictions” (Delmastro, 2005: 9) –but see Hansmann (1996).
Although two prestigious economists have recently provided a theoretical rationale for why something different happened3, Table 1 shows that wine cooperatives only took off in the major European wine-producing countries after the Second World War4. To explain why, Fernández and Simpson (2017), two economic historians specializing in the field, projected the view that wine economists usually have of what is happening today into the past and constructed a thesis that basically consists of two parts. First, from the very moment the first cooperatives were created at the end of the nineteenth century, they paid no attention to controlling the quality of the grapes they received, due to the enormous monitoring costs that doing so would have entailed, and they were forced to sell the bad wine they produced at low prices, which is why the vast majority of winegrowers preferred not to join them. Second, when from around 1950 the cooperatives and their members began to benefit from large public subsidies, membership became more attractive. But that was the only thing that changed, because, up until now, cooperatives have continued not to control the grapes and to produce bad wine. Therefore, if they ever stopped receiving public subsidies, they would again find themselves in a state of minor importance similar to the one they had before the 1950s.
TABLE 1
Wine produced by cooperatives (as % of all wine in the country)
| France | Italy | Spain | |
|---|---|---|---|
| 1929 | 8 | 2a | - |
| 1939 | 16 | 3 | 5b |
| 1950 | 23 | 3 | 11 |
| 1959 | 35 | 6c | 28 |
| 1970 | 39 | 18d | 50 |
| 1980 | 49 | 38 | 63 |
| 2000 | 52 | 55 | 70 |
| 2021 | 50 | 60 | 70 |
a 1927. b 1935. c 1957. d 1969.
Sources:
France: 1929 and 1939: Garrido (2021); 1950, 1959 and 1970: Confédération Nationale des Coopératives Vinicoles (1976, p. 140, 156 and 178); 1980: Fernández and Simpson (2017, p. 125); 2000: Anderson (2004, Table 2.2); 2021: See text.
Italy: 1929 and 1939: Federico and Martinelli (2018, p. 141); 1950: Corsi et al. (2018, p. 156); 1959: Fernández and Simpson (2017, p. 125); 1970: Corsi et al. (2018, p. 156); 1980: Fernández and Simpson (2017, p. 125); 2000: Anderson (2004, Table 2.2).
Spain: 1939 to 2000: See Figure 1; 2021: See text.
The first part of this argument was tested by Garrido (2021, 2022), who used non-parametric tests to show that there was no generalized free-rider behavior and that cooperative wine was sold, on average, at a price similar to the average market price5. However, the number of cooperative wineries barely increased. As winegrowers with a certain level of relevance rarely joined them, they were unable to generate sufficiently high economies of scale to compensate for the disadvantages that collective decision-making always entails. Yet, they were able to keep opportunism at bay without incurring large transaction costs, because in order to build their facilities they had to take out substantial loans, which were usually backed by the unlimited joint and several liability of the partners as a whole. As widespread opportunistic behavior would have made it more difficult to repay the loan, to the direct detriment of all, there was a mutual vigilance to prevent anyone from giving the cooperative their worst grapes, or simply a smaller quantity of grapes than they had committed to. And members were supportive of boards of directors imposing sanctions, which could be very harsh, when an opportunist was discovered.
In this article I will examine the robustness of the second part of Fernández and Simpson’s (2017) thesis. I intend to analyze whether, in addition to boosting their rapid growth, another consequence of the post-1950 ease with which cooperatives were able to obtain and renew loans was that their internal discipline broke down. What is said about this raises two major questions. On the one hand, if cooperatives are acting as “last resort buyers”, how is it possible that, especially in Spain, they have such a high market share? On the other hand, perhaps free-riders are only a minority of members, but since the result is still that cooperatives produce cheaper wine than they would if there were no free-riders, why, contrary to what collective action theory predicts (Ostrom, 1990), do the majority of members allow this situation to be perpetuated over time? Since nobody likes to “be taken for a ride”, if cooperatives were unable to prevent some people from not contributing all their grapes, the rest of the members would either do the same or leave the cooperative, which would in all likelihood soon be dissolved6.
2. Wine market regulation and cooperatives in Europe and spain
After the Second World War, many countries wanted to stabilize agricultural prices by means of buffer stock schemes: when the prices of certain products were low, public funds would be used to buy them, in order to release them when prices rose again (Wright, 2001). While the literature sometimes advises against such measures (as is the case of Williams and Wright [1991], in a theoretical book), other times it argues that they can produce excellent results (Abokyi, Folmer and Asiedu [2018], in an empirical article on Ghana). The point I am trying to make here is that one of the results of applying different variants of this type of intervention to European wine was that, from around 1950, wine cooperatives began to become more powerful.
In Spain and Portugal the state acted as a purchaser of wine, but –barring some exceptional cases– this did not occur in Italy and France7. Continuing the policies, it had begun to implement in the 1930s, in France the state fixed the price of alcohol and forced winemakers to distil a portion of their wine production, encouraged them to voluntarily distil another portion, and made them bring the rest to market in a staggered manner (Commission des Communautés Européennes, 1969). It also encouraged them to sign storage contracts.
If the wine was stored in the almost always antiquated private vats, the risk of spoilage was much higher than when using the normally well-maintained cement vats of the cooperatives (Commission des Communautés Européennes, 1969). In addition, a minimum volume of 100 hl of wine was required to sign a storage contract, which meant that the multitude of small farmers who produced less than 100 hl or sold their grapes because they did not own vats had to belong to a cooperative if they wanted access to those financial advantages. Thus, between 1961 and 1963, 2/3 of all the wine stored in France in exchange for premiums was already in the vats of the cooperatives (Barthe, 1966: 124), which also allowed the cooperators to easily obtain official loans at low interest rates.
As the Common Wine Policy of the European Economic Community (EEC) was modeled on the French system from the 1960s onwards, cooperatives also played this role in the EEC. In Italy they developed relatively late (Table 1) because there were no large wine surpluses there until well into the 1960s (Corsi, Pomarici & Sardone, 2018), whereas France and Spain had had them since almost two decades earlier.
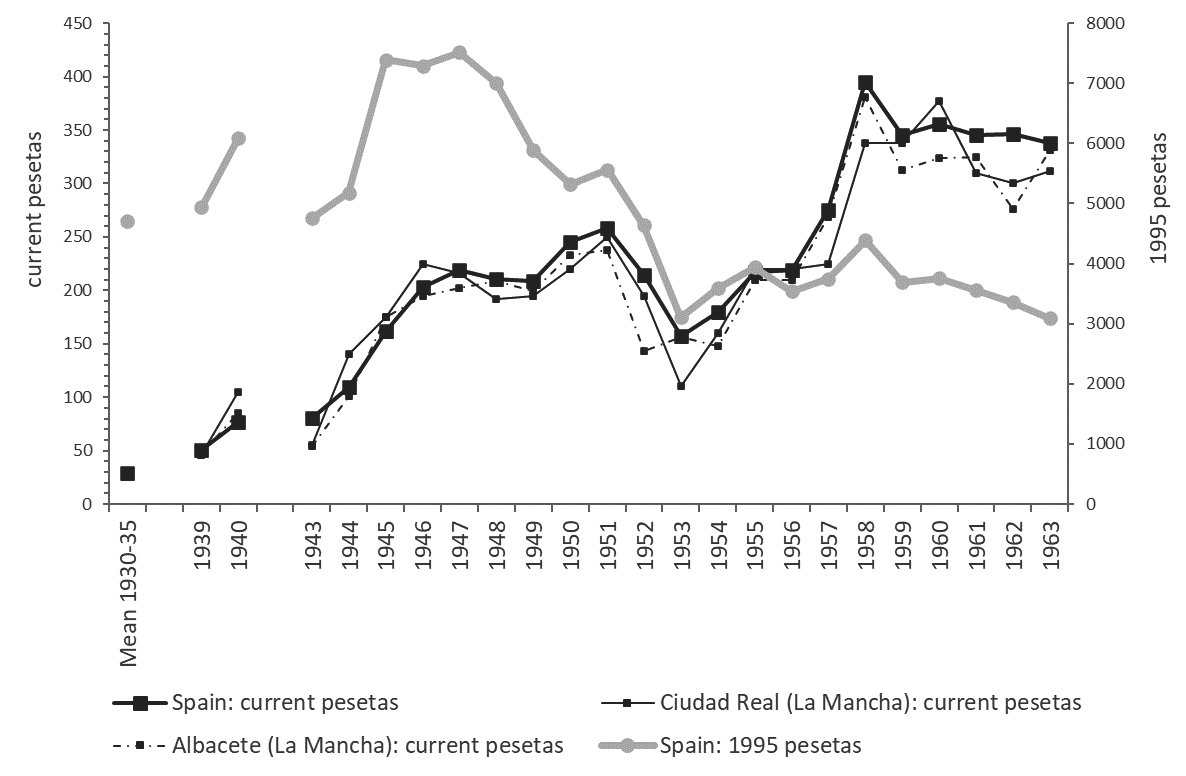
When after the civil war of 1936-39 table wine reached high prices in Spain (Fig. 1), the maximum prices at which it could be sold to the final consumer were fixed8. In France, in the second half of the 1940s something similar happened (Barthe, 1966). The Spanish and French authorities acted in this way because they saw table wine as a “food” and a basic source of energy for the working population (Corsi, Pomarici & Sardone, 2018). They also feared that excessive one-off price increases would produce undesirable permanent results, as per capita wine consumption was declining (Anderson & Pinilla, 2022) and many of those who stopped drinking wine because of the increase in the price might replace it for good with other beverages9.
FIGURE 1
Wine prices in Spain. Pesetas per hectoliter, 1930-1963
Source: Ministerio de Agricultura, 1930-63.
In Spain, in 1948 wine prices began to drop in real terms (Fig. 1). Between 1951 and 1953 they also plummeted in nominal terms and social unrest spread, so that in 1953 the first steps were taken for the state to purchase wine. Spanish vineyards –it was argued as a justification– tended to occupy hilly terrain that was unsuitable for other agricultural uses and would be abandoned if growing vines there became unprofitable, and thus rural emigration would accelerate unchecked. In a deeply nationalistic fascist regime, domestic wine was also seen as one of the elements that made up the soul of the nation (in democratic France something similar was happening). For all these reasons, the price of table wine never had to be excessively low or, for the reasons indicated above, too expensive for the consumer in a context where, until the 1980s, imports were tightly controlled by the state (Fernández & Pinilla, 2018).
With the technology available (stainless steel tanks only became widespread in Spain from the 1980s onwards; Fernández & Pinilla, 2018) the state found it unattractive to store wine and very attractive to give premiums and loans to producers so that, as in France, they could store it themselves. As mentioned above, the vats of the cooperatives were particularly well suited for this purpose. Moreover, when from time to time there was an oversupply of grapes, which are highly perishable, winegrowers without a winery had to get rid of them at any price, which often caused the price of wine to plummet as well. But for the state to buy grapes and make wine was highly problematic10. Giving subsidies to winegrowers to create many cooperative wineries was easier.
FIGURE 2
Spanish cooperative wineries (1944-2012)
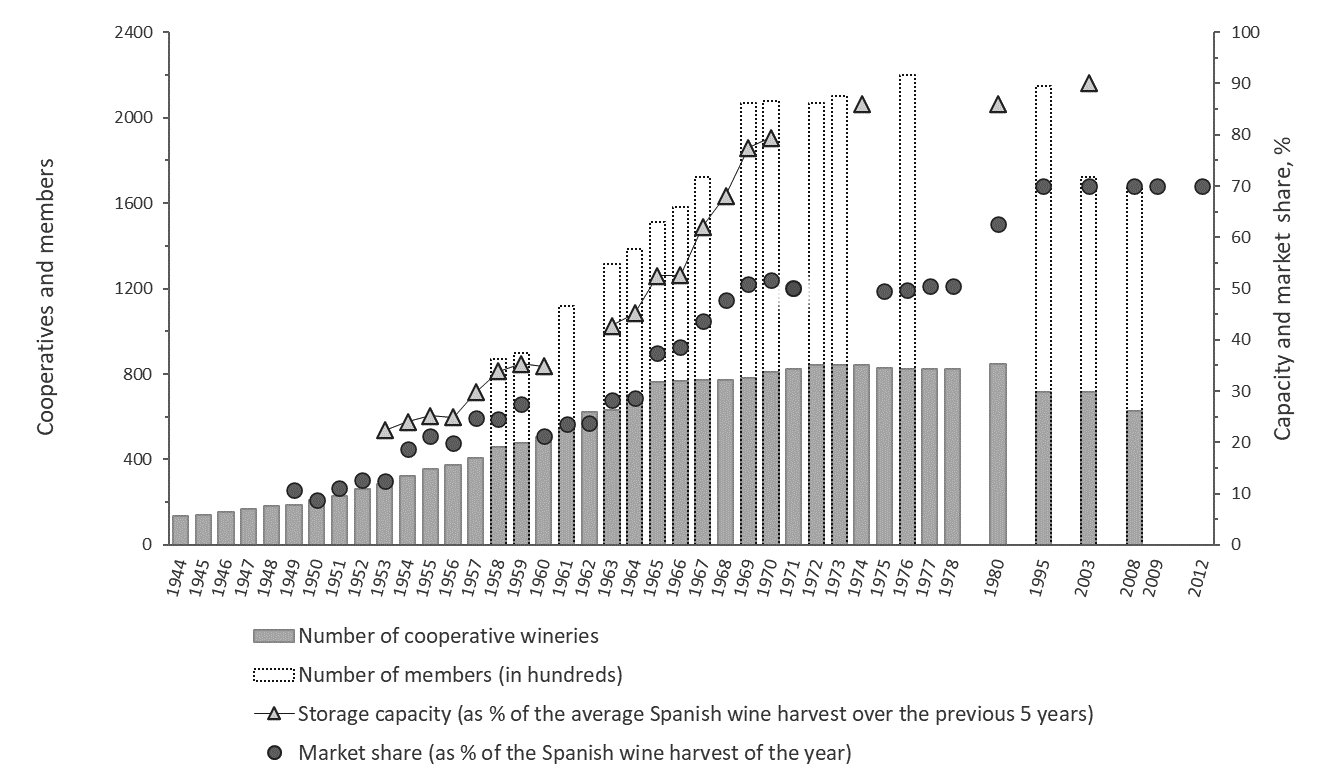
Sources: 1944-1978: UNACO (1944-1978); 1980: Cadenas and Mújica (1983, p. 15); 2003 and 2008: Cogega (2010, p. 55). 2009 and 2012: Agricultura, n. 921 (2009) and 654 (2012).
Hence, the two legal provisions (both dated 11 August 1953) that initiated the application of a buffer stock policy to Spanish wine also led to the proliferation of cooperative wineries, although they were not even explicitly mentioned.
The first of them established that the state would pay winemakers to store a minimum of 150 hl of wine. But few could do so because, in 1962, 75% did not have their own winery (INE, 1966), more than 70% cultivated less than 10 hectares of vines, and yields were very low in the country, about 15 hl per hectare (Fernández & Pinilla, 2018). However, in order to reach the minimum 150 hl, groups could be formed.
The second provision created the Comisión de Compras de Excedentes de Vino (Commission for the Purchase of Surplus Wine, hereafter referred to simply as the Commission). It purchased the wine it considered necessary to relieve the market11, but it had to be offered a minimum of 100 hl and the sellers had to hold onto at least 150% of the volume they offered. No less than 80% of the winegrowers were now excluded. Again, however, they were allowed to group together.
Both measures were conceived with the region of La Mancha in mind. It was considered to be the region regulating the Spanish wine market and the costs of producing wine there, which were lower than the Spanish average12, would be used to fix the guaranteed price at which the Commission would buy the wine. At that time, La Mancha produced one third of Spanish wine, only 3% of the wine from the region came from cooperatives (UNACO, 1951), only 9% of winegrowers had a winery (INE, 1966), and price fluctuations were particularly accentuated (Fig. 1). It was feared that if the price of grapes plummeted in La Mancha during the grape harvest the price of wine in other regions would also plunge. To make it more difficult for this to happen, at the end of 1953 a government campaign was launched to create cooperatives in La Mancha13. In the following years, similar initiatives were carried out in other places where winegrowers without a winery were also particularly abundant14. As the state also offered, from 1946 onwards, loans at subsidized interest rates for agricultural cooperatives of any kind to build their facilities (Medina, 2016), the 263 cooperative wineries existing in 1952 had grown to 842 by 1972 (Fig. 2).
Many winegrowers needed to sell their wine immediately after producing it, which often led to seasonal price drops. To mitigate this and to make membership of a cooperative more attractive, each year the Commission lent (in official terminology, advanced) cooperatives a portion of the value of the wine they planned to produce, although, as will be explained below, it often settled its commitments with long delays. As a guarantee, the cooperatives had to tie up part of their production. Figure 3 reports the percentage that such loans represented with respect to the value of all the wine produced in Spain and with respect to the value of wine produced by cooperatives. The available data are incomplete, but we know that the advances received in 1958 by 232 cooperatives allowed the state to immobilize for some months 2.14 million hectoliters (Carrión, 1960: 16), 11% of the entire Spanish wine harvest. During the following years the number of cooperatives receiving “advances” grew steadily; in 1963 there were already 422 (UNACO, 1963).
FIGURE 3
The Commission and cooperative wineries (1953-1982)
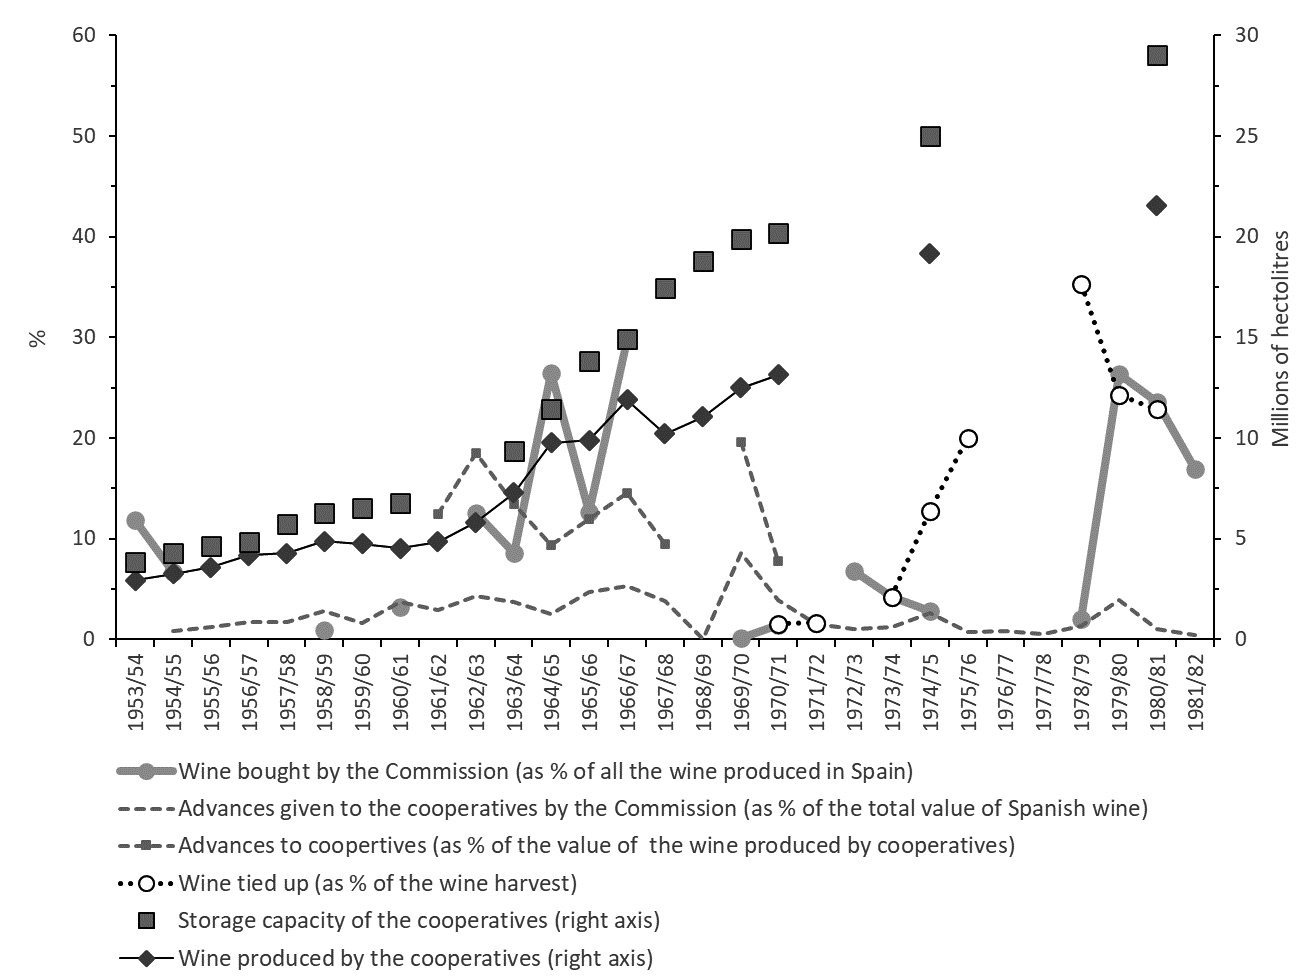
Sources: UNACO (1951-1976), La Semana Vitivinícola, n. 1457, 1974. Albisu and Vallés (1984). Ministerio de Agricultura, 1953-1981. Instituto Nacional de Estadística, 1953-1981.
As of 1963-64 the Commission was obliged to buy all the wine offered to it15. In each of the two major harvests of 1964-65 and 1966-67 it bought more than nine million hectoliters. Anderson and Valenzuela (2008), Josling (2009), and Clar, Martín-Retortillo and Pinilla (2018) maintained that in Franco’s Spain the subsidies received by farmers from the state were scant. However, Figure 3 suggests that this was not the case at least for winegrowers, especially those who belonged to cooperatives.
Soon, the government technicians themselves began to denounce that such purchases were very burdensome for the state and, at a time of weak exports (Fernández & Pinilla, 2018), not very effective in stabilizing prices16. What matters here is that the Commission was instrumental in making the cooperative wineries stronger (Carrión, 1973) because of the low-interest loans it gave them and because its guaranteed prices provided perverse incentives for cooperatives in some provinces (as well as winemakers who were not members) to produce, profitably, large volumes of wine “destined in advance for distillation and of mediocre quality”17 –I explain the matter in more detail in Appendix 3. Many well-to-do merchants and farmers were also involved in this fraud, but small farmers in these provinces needed to be members of a cooperative in order to benefit from it18.
From the late 1960s onwards, efforts were made to bring Spanish regulations into line with those of the EEC, to encourage the production of higher quality wine and to give new premiums to those who signed storage contracts (Laporte & Lifran, 1980; Cadenas & Mújica, 1983). Such premiums acted as an incentive for cooperatives to take out official loans in order to increase the capacity of their warehouses and to be able to store more wine. In the medium term, this favoured further expansion, but one of the measures taken had the opposite effect in the short term.
In line with what was being done in the EEC, as of 1971-72 the Spanish state obliged winegrowers to sell to it a quantity of wine or wine-making residues (marc, dregs, and lees) containing alcohol equivalent to 10% of all the alcoholic strength they would have created when transforming the grapes into wine. The intention was that, since most of them would presumably use the residues from winemaking for this purpose, they would not over-press the grapes during the winemaking process, to the benefit of the quality of the wine. But the price they would be paid for the alcohol would be linked to the guaranteed price of the wine, at a time when both alcohol and wine were fetching high market prices and selling them to the state was not an attraction proposition19. There were numerous complaints, mainly from cooperatives. They argued that, as they were subject to strict administrative controls, they declared all the wine and alcohol they produced, while the rest of the winegrowers could easily conceal theirs. This probably contributed to the fact that many members did not deliver all their grapes to the cooperatives and that their market share stagnated during the final stage of Franco’s regime (Fig. 2). Nevertheless, their storage capacity increased by 50% during the 1970s (Fig. 3), so that by 1980 it was clearly oversized.
3. Regulatory policy, cooperatives, and wine quality
Until well into the twentieth century, European wine was classified in three broad categories: table wine, which was cheap wine that was usually purchased in bulk by the end consumer; quality wine, which was usually matured wine and was often bottled; and fine wine, which was quality wine from a few privileged geographical areas (such as Bordeaux, Burgundy, or Champagne). In turn, within each category, especially the last two, there was a wide range of grades and prices. Those who maintain that cooperatives have always produced bad wine tend to emphasize three things:
a) The first cooperatives did not, with a few exceptions, produce quality and fine wines. This was indeed the case. But Figure 4 shows that, between 1907 and 1913, 98% of all the wine in France was table wine; more strikingly, 84% and 87% of the wine produced in the departments of Gironde (Bordeaux) and Côte-d’Or (Burgundy) was also table wine.
The wine maturation process required large investments and financial capacity to withstand the delays with which the wine was sold. As the demand for expensive wine was relatively low, making it was also a high-risk activity. If until very late in the twentieth century it was common for even large winegrowers to produce only table wine20, it does not seem to make much sense to reproach the cooperatives, which consisted mostly of modest farmers, for making table wine21.
FIGURE 4
Volume of table wine produced in France, as % of all French wine (1907 1913)
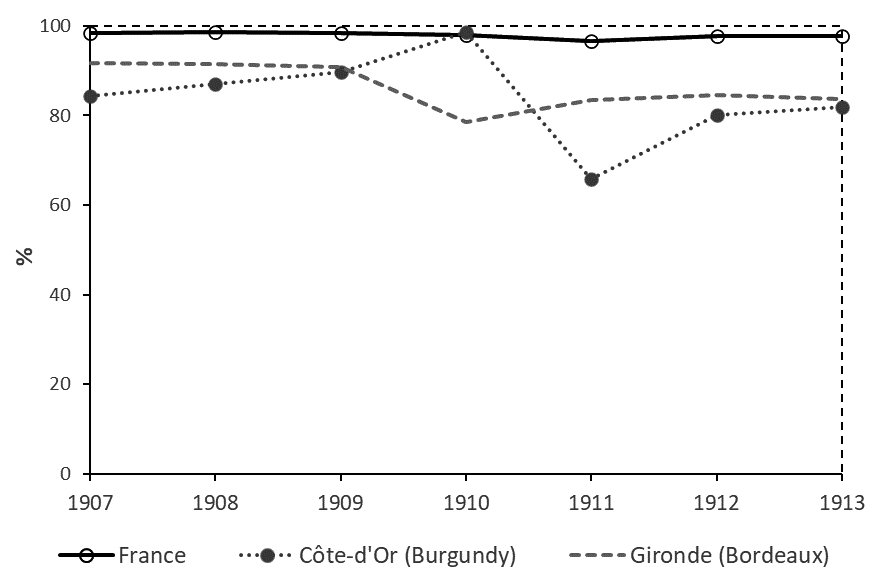
Source: Ministère du Commerce (1908–1915).
b) As the market share of the cooperatives grew, the production of table wine became relatively more significant. But, according to Figure 5, this did not happen in Spain. As in France, it was certainly difficult to do so, given the very high baseline levels.
c) The quality of the typical wine from cooperative wineries was very poor. In fact, the oenological and agronomic literature often praised the cooperatives’ wine: as they were highly mechanized and modernized22, used cement vats, followed standardized production methods, implemented relatively strict measures of hygiene and were usually advised by oenologists, they were able to produce large volumes of table wine with a quality that could be considered “correct” and uniform (Galtier, 1960; Lachivier, 1988: 499; Saumell, 2002; Medina & Planas, 2020; Garrido, 2022). In contrast, the quality of non-cooperative wine tended to experience broad fluctuations from one year to the next. To correct this great variability, it was common for merchants to blend wines of different origins, using the wine from the cooperatives as a “base”.
FIGURE 5
Table wine and quality wine in Spain, % (1935-1971)
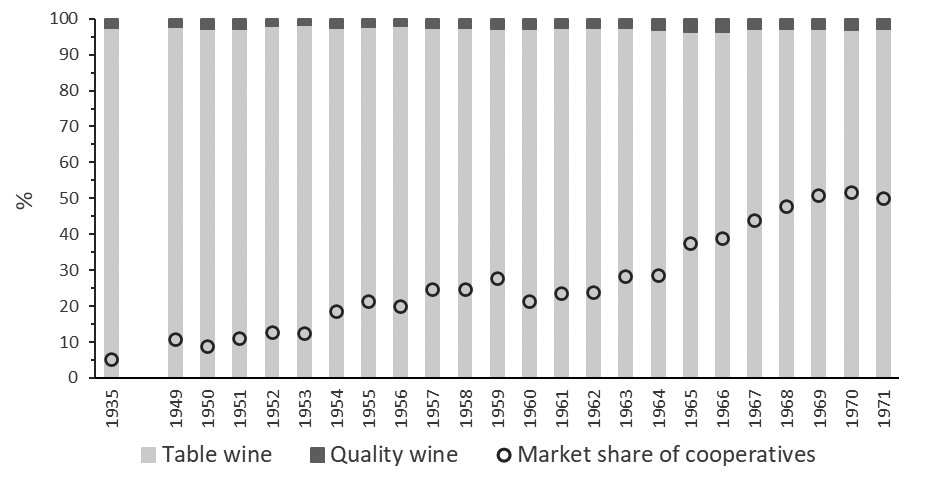
Source: Ministerio de Agricultura, 1935-1971; Garrido (2022); and UNACO (1949-1971)
Nevertheless, it is true that from the 1950s onwards the average quality of Spanish table wine declined. Because of the way it was designed and applied, the purchase of wine at guaranteed prices encouraged most winemakers in a few major wine-producing provinces to voluntarily lower the quality of their product (Appendix 3). This only happened in La Mancha and in some areas with similar low production costs, because in the rest of Spain it was not profitable to do so, although all winegrowers in Spain benefited from the fact that the Commission bought wine in those provinces, because it lowered the supply of wine on the market at the national level. Contrary to what is usually believed, the Commission did not only buy from cooperatives, but also –and sometimes mainly– to well-off farmers with cellars who did not belong to any cooperative winery (Figs. 6 and 7).
In 1966-67 the Commission bought 9.13 million hectoliters, of which 4.83 million hectoliters came from non-cooperative companies and 4.30 million hectoliters came from cooperative wineries23. Seven provinces, out of the 50 which make up Spain, sold 90.3% of the non-cooperative wine to the Commission. These were almost exactly the same seven provinces that sold 94.6% of the cooperative wine to it (Figs. 6 and 7). Unfortunately, we only have disaggregated data at the provincial level for that season, but a wealth of qualitative information on the preceding and subsequent years suggests that the geographical origin of the Commission’s purchases hardly varied over time. The bulk always came from La Mancha, which, partly as a result of these purchases at guaranteed prices (Christiansen, 2012: 246), already produced 43% of all Spanish wine by the mid-1970s24 –and 50% in the early 2000s.
FIGURE 6
Origin of wine, by provinces, purchased by the Commission in 1966
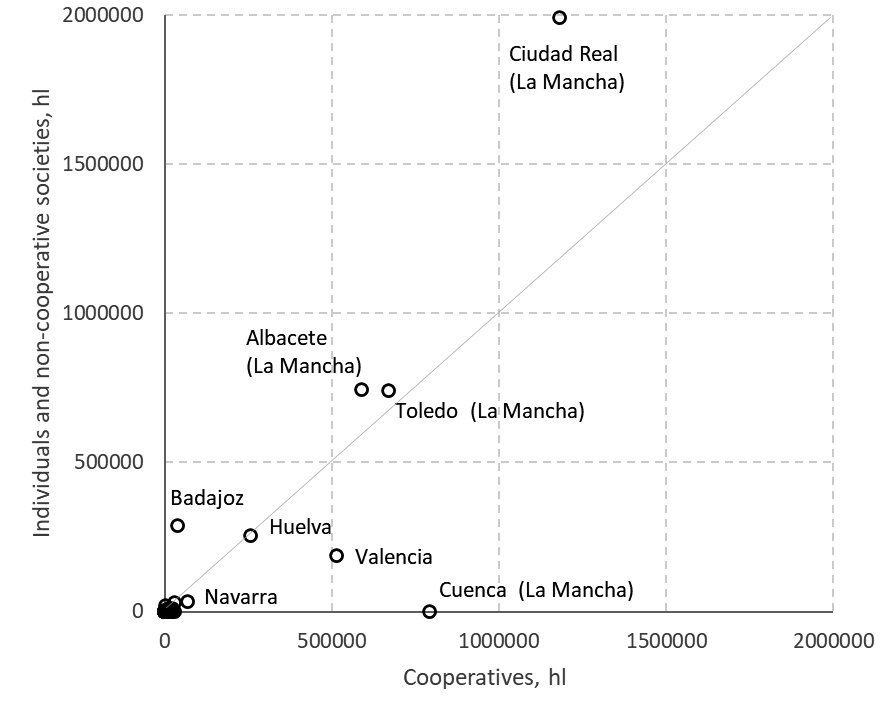
Source: Report of the Commission for the Purchase of Surplus Wine for the 1966/67 season. AGA, (06)038.001, box 284, top. 35/50.303-51.
In general, the cooperatives strove to continue to produce good table wine, imposed fines on those who broke the rules, expelled those who breached them repeatedly, and so on (Ferrer, 1957; Piqueras, 2009; Sanz Suescun, 2010; Gangutia, 2013; Muruzabal, 2014). But, basically in La Mancha, cooperatives were set up, often by people with little cooperative spirit (Gómez, 2003), with the main purpose of selling bad wine to the Commission25. Despite the fact that the statutes stipulated the obligation to contribute all the grapes, the member who only brought his poorest quality grapes to such a cooperative was not, in reality, acting as a free-rider, because he did not benefit from the fact that there were other members who did contribute good grapes, since nobody else did so. What happened in one district in the province of Valencia, the Vall d’Albaida, provides a powerful illustration of this idea. Although table grapes were the main crop, it was common for farmers in the region to produce both table grapes and grapes for winemaking. Small cooperative wineries sprang up in almost all the villages. When adverse weather conditions or pests caused the table grapes to spoil, they used them to make poor wine which they sold to the Commission (Carrión, 1960).
If before the civil war cooperatives were usually strict in enforcing the rules (Garrido, 2022), an additional circumstance now influenced many to adopt a more relaxed attitude: the Spanish state bought wine and easily granted loans and subsidies, but it was often a slow payer. As a result, many members often needed to sell part of their grapes on the market to obtain liquidity26, and many cooperatives, at the will of their members, began to tolerate the fact that their members did not provide them with the whole harvest27. Neither can this really be considered a form of free-rider behavior. The crux of the matter is that cooperatives are not “obliged” to tolerate opportunism on the part of their members. Sometimes they tolerate it and sometimes they do not. When they do, it is usually in response to the wishes of the majority of their members. This is the explanation for a paradox that seems to contradict the predictions of the collective action theory (Ostrom, 1990: 95): despite the fact that many members sometimes behaved in an apparently free-rider manner, cooperative wineries did not usually lose members or collapse.
4. The determinants of the provincial strength of wine cooperatives
Before the 1950s, in France, Italy, and Spain, cooperative wineries had only been strong in some areas. Basically, due to the conflicts generated by a sharecropping contract called rabassa morta, in Spain they were heavily concentrated in Catalonia (Garrido, 2021). When, from 1953 onwards, the state wanted them to be created wherever there were vineyards (which was the case in all Spanish provinces), the differences tended to diminish, but at the end of Franco’s dictatorship they were still strong (Fig. 7)28. In this section I use econometrics to analyze why this occurred and to test some of the ideas put forward so far.
FIGURE 7
Provincial market share of cooperative wineries in 1971/72 and provinces selling large volumes of wine to the Commission (those where the name is indicated)
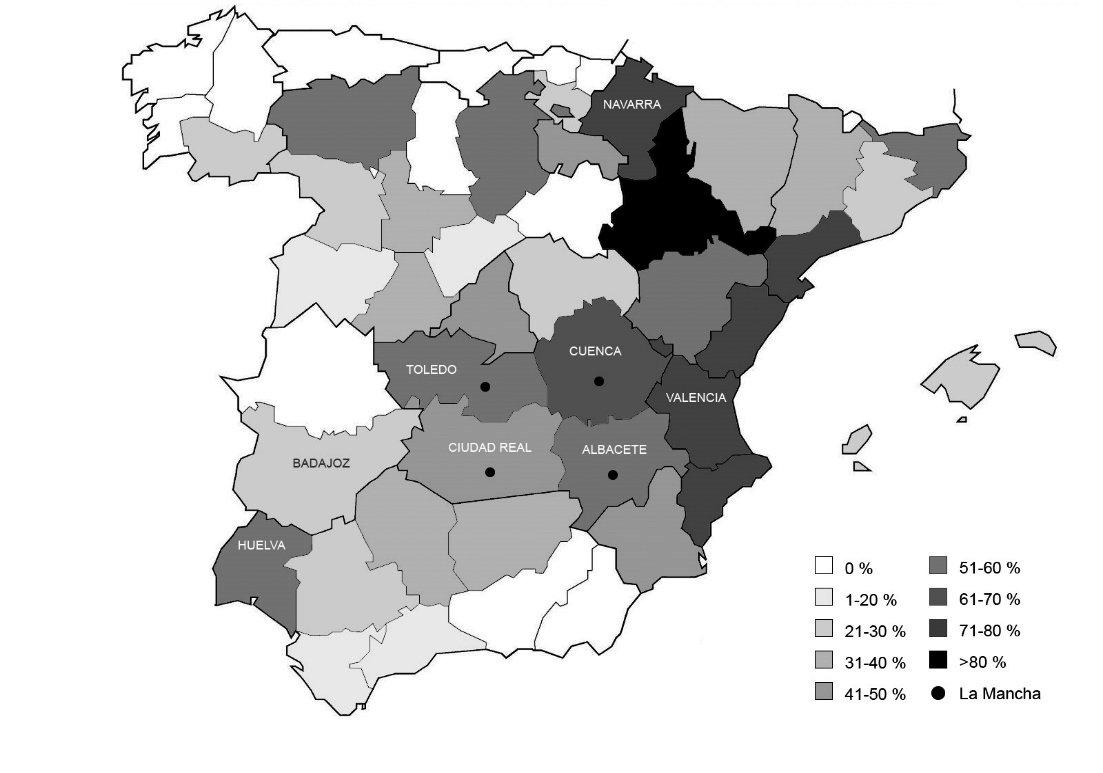
Source: AGA, sig. 74, top. 35/50.501. Own elaboration
The ideal situation would have been to be able to use a panel data model with provincial market shares as the dependent variable, but data with a certain degree of quality are only available for the 1971-72 season. In order to ensure that both cooperatives and non-member farmers handed over 10% of the wine alcohol they had produced, authorities and cooperatives agreed on the “true” provincial market shares of the cooperatives29. In columns I to III of Table 2 I use ordinary least squares to find out what determined them. As a complement, in columns IV to VI of the same Table 2, I use a count data model in which the dependent variable is the number of existing wine cooperatives per province in 1972 (the correlation between market share and number of provincial cooperatives is 0.71)30.
The negative sign of the first and second independent variables I use, % of wine sold at the guaranteed price and the seven provinces that sold the most to the Commission (dummy), suggests that, all else being constant, the Commission’s wine purchases did not lead to a higher market share for cooperatives in one province or to a greater number of cooperatives in that province.
As expected, the coefficients (OLS) and marginal effects (NBREG) of the variable % of holdings with wineries also have a negative sign, because initially the cooperatives attracted mainly farmers without wineries who did not want to have to sell their grapes on the market and thus to be eligible for various state subsidies.
Common sense and abundant local case studies suggest that neither micro-holding owners nor large winegrowers tended to join the first cooperative wineries. Therefore, when the variable average holding size is squared its initial positive sign becomes negative.
The label % of vineyard indicates the percentage of the cultivated area in each province used to grow vines. Where this percentage was low, many of the grapes that the cooperatives processed would have to come from holdings located far from their facilities, with the resulting increase in transport and supervision costs, because it was more expensive for the cooperative to check whether the members’ vineyards were well cultivated and to determine the state of health of the grapes. In these provinces it was more difficult for the cooperative movement to flourish. Indeed, the higher the percentage of vines was, the greater the market share of the cooperatives was (columns I and II of Table 2) and the more cooperative wineries there were in the province (columns III and IV).
TABLE 2
Determinants of the provincial market share of cooperative wineries (1971/72 season) and of the number of cooperative wineries (1972)
| Ordinary least squares (OLS). | Negative Binomial Regression (NBREG). Marginal effects. | Dependent variable: market share | Dependent variable: number of cooperatives | I | II | III | IV | V | VI |
|---|---|---|---|---|---|---|---|
| % of wine sold at the guaranteed price | –0.09 (–0.60) | –0.005 (0.03) | –0.10 (–0.65) | –0.09 (– 0.53) | |||
| Provinces which sold the most | –11.60 (–1.15) | –3.23 (–0.31) | |||||
| to the Commission (dummy) | |||||||
| % of holdings with wineries | –0.56 (–2.98) *** | –0.59 (–3.43) *** | –0.66 (–3.57) *** | –0.70 (–2.13) ** | –0.64 (–2.08) ** | –0.73 (–2.45) ** | |
| Average holding size (ha) | 18.39 (3.24) *** | 17.74 (3.38) *** | 18.66 (3.75) *** | 36.87 (2.72) *** | 29.61 (2.78) *** | 30.20 (2.81) *** | |
| Average holding size, squared | –3.54 (–3.51) *** | –3.17 (–3.41) *** | –3.15 (–3.95) *** | –6.05 (–2.84) *** | –4.36 (–2.80) *** | –4.36 (–2.77) *** | |
| % of vineyard | 1.78 (6.07) *** | 1.49 (3.14) *** | 1.78 (3.42) *** | 2.41 (2.61) *** | 1.50 (1.65) * | 1.76 (1.84) * | |
| Ln altitude (103 masl) | 11.30 (3.15) *** | 8.17 (2.49) ** | 8.47 (2.33) ** | 19.19 (2.54) ** | 11.01 (2.30) ** | 10.63 (2.17) ** | |
| % drop in wine prices, 1943-1953 | 0.18 (1.30) | 0.20 (1.34) | 0.16 (1.24) | 0.55 (2.34) ** | 0.51 (2.78) *** | 0.52 (2.72) *** | |
| Average price of wine, 1943-1952 | –4.74 (–3.33) *** | –2.55 (–1.50) | –3.28 (–1.75) | –6.68 (–2.04) ** | –2.41 (0.94) | –3.24 (–1.22) | |
| (pta/hl) | |||||||
| Social capital (agrarian cooperatives | 0.09 (2.67) ** | 1.08 (2.50) ** | 0.08 (2.04) ** | 0.08 (2.30) ** | |||
| in1933) | |||||||
| % illiteracy | –0.15 (–0.49) | –0.13 (–0.45) | –0.56 (–1.50) | –0.57 (–1.48) | |||
| Cooperative wineries in 1944 | 0.09 (0.30) | –0.52 (–0.17) | 0.25 (1.09) | 0.11 (0.39) | |||
| Constant | –28.60 (–1.13) | –26.22 (–0.92) | –22.04 (0.70) | ||||
| N | 50 | 50 | 50 | 50 | 50 | 50 | |
| Mean Dependent Variable | 31.61 | 31.61 | 31.61 | 17.20 | 17.20 | 17.20 | |
| R2 | 0.71 | 0.74 | 0.75 | ||||
| F | 56.10 *** | 85.56 *** | 98.96 *** | ||||
| Chi2 | 124.16 *** | 231.38 *** | 216.83 *** |
Between parentheses, clustered standard errors (OLS) and robust standard errors (NBREG). *** < 0.01, ** < 0.05, * < 0.1
Source: Appendix 1
Altitude expresses the average height above sea level of each province. When analyzing the determinants of the location of Spanish wine cooperatives before 1936, altitude had a negative sign, high marginal effects, and statistical significance (Garrido, 2021). This was because a higher average altitude meant a greater probability of early spring frosts, which usually produce important losses in the grape harvest. As the risk of frost rises, winegrowers were less likely to set up cooperatives –among other reasons, because banks were more reluctant to lend them money. In contrast, altitude now has a positive sign. This is probably because the higher the risk of frost is, the more attractive it was for winegrowers to belong to a cooperative that would facilitate their access to official aid and credit.
Medina (2016) argued that cooperative wineries were stronger in the provinces where the price of wine dropped the most. The variable % drop in wine prices, 1943-53 confirms this idea: the sign is always positive, although there is statistical significance only in the NBREG (number of cooperatives).
An econometric study of Catalan cooperative wineries in the early twentieth century used disaggregated data at the municipal level and showed that they tended to be set up in municipalities that produced wine with a relatively low alcohol content (Garrido, 2021). As the price of table wine was usually determined by the alcohol content of the wine (the higher the alcohol content, the higher the price), winegrowers were less inclined to join cooperatives in places where wine had more alcohol. As a proxy for the average alcohol content of wine I used the variable average price of wine, 1943-51, (that is, during the decade before the creation of the Commission), which has the expected negative signs.
I then used three control variables (columns II and V of Table 2). O’Rourke (2007), Beltrán (2012), Martínez Soto, Martínez Rodríguez and Méndez (2012), Fernández (2014), Garrido (2014, 2021), and Medina et al. (2021), among others, showed that where people have greater trust in each other, and therefore the so-called social capital is higher, more cooperatives tend to be set up. To measure social capital, I used the number of existing agricultural cooperatives of all types per province in 1933, which was found to have a positive sign and statistical significance, although low coefficients and marginal effects31. The variables % of illiteracy and number of cooperative wineries in 1944 (when the Commission did not yet exist) both have the expected signs (negative and positive, respectively), but are not statistically significant at conventional levels.
Finally, in Table 3 I used a panel data model in which the dependent variable is the number of wine cooperatives created per province over six periods (1945-49, 1950-54, 1955-59, 1960-64, 1965-69, and 1970-74). I utilized a population-averaged negative binomial model, which I implemented following Cameron and Trivedi (2010: 641). Columns I and II include only the first four periods (1945 to 1964), which are the only ones for which information on the provincial evolution of wine prices is available, while column III refers to all six periods (1945 to 1974). Altogether, 753 wine cooperatives were created in Spain during these six periods (an average of 15.06 cooperatives per province and 2.51 cooperatives per province and period).
TABLE 3
Panel data: population average negative binomial regression. Marginal effects. Dependent variable: wine cooperatives set up by province and period.
| Ordinary least squares (OLS). | Negative Binomial Regression (NBREG). Marginal effects. | Dependent variable: market share | Dependent variable: number of cooperatives | I | II | III | IV | V | VI |
|---|---|---|---|---|---|---|---|
| % of wine sold at the guaranteed price | –0.09 (–0.60) | –0.005 (0.03) | –0.10 (–0.65) | –0.09 (– 0.53) | |||
| Provinces which sold the most | –11.60 (–1.15) | –3.23 (–0.31) | |||||
| to the Commission (dummy) | |||||||
| % of holdings with wineries | –0.56 (–2.98) *** | –0.59 (–3.43) *** | –0.66 (–3.57) *** | –0.70 (–2.13) ** | –0.64 (–2.08) ** | –0.73 (–2.45) ** | |
| Average holding size (ha) | 18.39 (3.24) *** | 17.74 (3.38) *** | 18.66 (3.75) *** | 36.87 (2.72) *** | 29.61 (2.78) *** | 30.20 (2.81) *** | |
| Average holding size, squared | –3.54 (–3.51) *** | –3.17 (–3.41) *** | –3.15 (–3.95) *** | –6.05 (–2.84) *** | –4.36 (–2.80) *** | –4.36 (–2.77) *** | |
| % of vineyard | 1.78 (6.07) *** | 1.49 (3.14) *** | 1.78 (3.42) *** | 2.41 (2.61) *** | 1.50 (1.65) * | 1.76 (1.84) * | |
| Ln altitude (103 masl) | 11.30 (3.15) *** | 8.17 (2.49) ** | 8.47 (2.33) ** | 19.19 (2.54) ** | 11.01 (2.30) ** | 10.63 (2.17) ** | |
| % drop in wine prices, 1943-1953 | 0.18 (1.30) | 0.20 (1.34) | 0.16 (1.24) | 0.55 (2.34) ** | 0.51 (2.78) *** | 0.52 (2.72) *** | |
| Average price of wine, 1943-1952 | –4.74 (–3.33) *** | –2.55 (–1.50) | –3.28 (–1.75) | –6.68 (–2.04) ** | –2.41 (0.94) | –3.24 (–1.22) | |
| (pta/hl) | |||||||
| Social capital (agrarian cooperatives | 0.09 (2.67) ** | 1.08 (2.50) ** | 0.08 (2.04) ** | 0.08 (2.30) ** | |||
| in1933) | |||||||
| % illiteracy | –0.15 (–0.49) | –0.13 (–0.45) | –0.56 (–1.50) | –0.57 (–1.48) | |||
| Cooperative wineries in 1944 | 0.09 (0.30) | –0.52 (–0.17) | 0.25 (1.09) | 0.11 (0.39) | |||
| Constant | –28.60 (–1.13) | –26.22 (–0.92) | –22.04 (0.70) | ||||
| N | 50 | 50 | 50 | 50 | 50 | 50 | |
| Mean Dependent Variable | 31.61 | 31.61 | 31.61 | 17.20 | 17.20 | 17.20 | |
| R2 | 0.71 | 0.74 | 0.75 | ||||
| F | 56.10 *** | 85.56 *** | 98.96 *** | ||||
| Chi2 | 124.16 *** | 231.38 *** | 216.83 *** |
Between parentheses, robust standard errors. *** < 0.01, ** < 0.05, * < 0.1
Source: Appendix 2
The first five independent variables in columns I to III of Table 3 were already used in Table 2 and always maintain their signs and statistical significance. The variable % drop in wine prices (columns I and II) confirms that the drop in the price of wine between the periods acted as a stimulus for the creation of cooperative wineries. The next four variables (columns II and III) are control variables. Illiteracy, which is now statistically significant, has the expected negative sign. From the 1950s onwards, there was a continuous increase in litres of wine obtained per hectare (Fernández & Pinilla, 2018); where yields increased the most, more cooperatives were set up. Conversely, the higher the GDP per capita of a province was, the fewer cooperatives emerged; this was possibly because the “propaganda campaigns”, for which only incomplete information is available, were mostly carried out in provinces where GDP per capita was lower than the national average. Social capital continues to have a positive sign and statistical significance.
After the stagnation of the 1970s, by 1980 the market share of Spanish cooperative wineries was growing again (Fig. 2). Several factors contributed to this. To begin with, during the 1975-76 season the obligation for winemakers to sell 10% of the alcohol they produced to the state was temporarily abolished; as already mentioned, this abolition encouraged members to hand more grapes over to their cooperatives. Moreover, in the 1970s the vines registry started to be drawn up, which, by making it more difficult for vine growers to conceal their harvests, reduced the reluctance of many to join cooperatives. Cooperatives welcomed them with open arms: as their storage capacity was often oversized and they failed to make full use of the machinery they had bought with cheap loans (Omer, 1975), the grapes of the new members made it easier for them to achieve economies of scale. Finally, as was happening in France (Loubère, 1990), many of the new entrants were large landowners. Sporadically, there were cooperatives that already had members with these characteristics from much earlier (Medina, 2016; Planas & Medina, 2017), but now the phenomenon spread further afield.
Faced with the dilemma of making large investments in order to modernize their private winery facilities or join cooperatives, from the late 1970s onwards many wealthy landowners opted for the second option (Laporte & Lifrán, 1980: 73), which was more economical and, moreover, allowed them to access low-interest government loans. They were also influenced by the fact that during the years after 1975 there was a substantial increase in wages in the agricultural sector, so that joining cooperatives enabled them to do without the salaried staff they had needed to make wine (Piqueras, 2009). Sometimes the large landowners were also traders, and after they stopped making wine on their own they used their old vats to continue distributing the wine they now bought from their cooperative as they received orders from customers, so that it would not spoil and they would not have too much capital tied up in the form of wine (Morales, 1976)32. This suggests that, at a time when a taste for more expensive wine of a certain quality was beginning to spread in Spain (Fernández, 2012), the wine produced by the cooperative was no worse than what they would have made by themselves, which provided a further argument against the validity of what might be called the free-rider member hypothesis.
In 1986 Spain joined what was then the EEC (now the EU). This meant that Spain ceased to have its own wine policy and adopted the Common Wine Policy. As a result, Spanish winegrowers could no longer sell wine at guaranteed prices, but were ensured guaranteed prices for the sale of distilled wine. During the following years many cooperative wineries merged, some disappeared, and the total number of members decreased, but this did not prevent their market share from increasing (Fig. 2).
In order to improve the quality of the wine, reduce surpluses and raise winegrowers’ incomes, the EEC subsidized the permanent grubbing-up of vineyards in areas unsuitable for growing vines. At the same time, it subsidized the undertaking of improvement measures (localized irrigation, change of varieties, and so forth) in areas that were suitable for cultivating them. In Spain, some 250,000 hectares of vines were grubbed up, while another 300,000 hectares received subsidies to help restructure them (Piqueras, 2008). Mainly as a result of these steps, the 1.6 million hectares of vineyards that the country had in 1986 dropped to 1.1 million in 2006. Likewise, the yields of 21 hl/ha in the first of those years became almost 40 hl/ha in 2006, so that the wine harvest increased (from 33 to 45 million hectoliters) and the problem of chronic surpluses was accentuated, rather than being solved. This was especially so in La Mancha and Badajoz. By 2006, the former was already producing half of all Spanish wine.
Understandably, Spain was the country that received the most funding for the various forms of subsidized distillation. In the EU as a whole, between 1987 and 2011, 14% of all wine production was distilled, but in Spain it was 20% (Meloni & Swinnen, 2013: 253). As had already happened during Franco’s regime with the purchase of wine at guaranteed prices, the bulk of wine for distillation came from cooperatives and non-associated winegrowers in just a few provinces, “where many farmers produce with a view to distillation” (Piqueras, 2008: 314). By 2002, La Mancha and Badajoz together accounted for 82% of the wine distilled (Martínez Carrión & Medina, 2010), and between 2001 and 2007 around 58% of all wine from La Mancha was distilled. Given the unsustainability of the situation, in 2008 the EU carried out a reform of the Common Wine Policy that eliminated many intervention measures, including subsidies for distillation, although giving member states some room to maneuver.
After 2008, the Spanish wine sector and in particular the cooperatives (producing 70% of all the wine in the country) were able to react, including the cooperatives in La Mancha. One example of this reaction was a dramatic increase in the volume of wine being exported (Bono, Castillo & Iliopoulos, 2012; Langreo & Castillo, 2014; Fernández & Pinilla, 2018). It does not seem, therefore, that the reduction of interventionism –which is still very strong– has meant the beginning of a return to the situation of low importance that cooperatives had before the 1950s.
5. Conclusions
This article has stressed that cooperative wineries began to thrive around 1950 thanks to the new directions taken at that time by the European wine regulatory policy, which considered cooperatives to be an indispensable instrument to avoid large price fluctuations. In one of the most important theoretical texts ever written on cooperatives, Hansmann (1996) drew on examples from the United States and argued that, because it was cheaper for farmers to own the company that bought their crops or sold them supplies than to use market contracts, cooperatives were already strong before they began to receive privileges from governments. But this was clearly not the case with European cooperative wineries: they only became important when governments began to consider them essential to regulate prices and hence the aid and subsidies they received grew substantially.
It was now much easier than in the past for them to obtain and renew loans, which removed incentives for members and boards of directors to continue to bear the costs of mutual monitoring and the imposition of sanctions (Ostrom, 1990). But, contrary to what many wine economists argue –and Fernández and Simpson (2017) using a historical perspective–, free-rider behavior was not widespread among members when it came to handing their grape harvest over to them. This type of behavior, encouraged by purchases of wine at guaranteed prices, tended to occur only in cooperative wineries in some very specific areas and, as defended in the article, was not strictly speaking free-rider behavior, but an adaptation to the will of the majority.
The guaranteed prices caused the quality of the wine produced by the cooperatives in La Mancha and other areas with similar characteristics to plummet. But this only occurred in those areas, where the quality of the wine produced by affluent winegrowers with wineries who were not members of cooperatives also fell sharply. As these areas together produced around 50% of Spanish wine, its quality also decreased. And Spanish agrarian cooperatives as a whole acquired a reputation for producing bad wine. But, in actual fact, the vast majority of them (that is to say, those not located in these areas) continued to strive to produce good table wine with a quality that remained stable over time.
Tirole (1996: 1) argued that, in companies, collective reputation is a result of how stimuli, both current and past, influence people’s behavior, so that “new producers may suffer from prior mistakes of older producers even after they have disappeared”. This is what is happening with the bad reputation currently enjoyed by cooperative wineries. Yet, the mistakes of the past, although they now affect the reputation of the cooperative wineries as a collective, were not generalized and were brought about by governments. After Spain joined the European Community, the mistakes, because of distillation at guaranteed prices, have gone on almost down to the present day.
ACKNOWLEDGMENTS
The author received financial support from the Spanish Ministry for Science, Innovation and Universities, PGC2018-095529-B-100, and from the Valencian regional government, PROMETEO/2020/08. The author acknowledges the editorial board of Historia Agraria and the reviewers.
REFERENCES
Abokyi, Emmanuel, Folmer, Henk & Asiedu, Kofi (2018). Public Buffer Stocks as Agricultural Output Price Stabilization Policy in Ghana. Agriculture & Food Security, 7 (69).
Albisu, Luis Miguel & Vallés, Javier (1984). Desequilibrios de la oferta y demanda de vino en España. Revista de Estudios Agrosociales, (129), 133-53.
Allen, Douglas W. & Lueck, Dean (2019). The Organization of Vineyards and Wineries. In A. Alonso et al. (Eds.), The Palgrave Handbook of Wine Industry Economics (pp. 325-37). London: Palgrave Macmillan.
Anderson, Kym (Ed.) (2004). The World’s Wine Markets: Globalization at Work. Cheltenham: Edward Elgar.
Anderson, Kym & Valenzuela, Ernesto (2008). Estimates of Global Distortions to Agricultural Incentives, 1955 to 2007. Washington, DC: World Bank.
Anderson, Kym & Pinilla, Vicente (2022). Wine’s Belated Globalization, 1845-2025. Applied Economy Perspectives and Policy, 44 (2), 742-65.
Barciela, Carlos (1985). Introducción. In Ramon Garrabou (Ed.), Historia agraria de la España Contemporánea (pp. 383-454). Vol. 3. Barcelona: Crítica.
Barciela, Carlos (1989). Intervencionismo y crecimiento agrario en España, 1936-1971. In Pablo Martín Aceña and Leandro Prados (Eds.), La nueva historia económica en España. Madrid: Tecnos.
Barthe, René (1966). Economie et politique viticoles de la France (1950-1965). Ph.D. diss. Montpellier: Université de Montpellier.
Bartoli, Pierre (1984). La politique viticole communautaire: Analyse et bilan. Économie rurale, (164), 34-44.
Beltrán, Francisco (2012). Commons, Social Capital, and the Emergence of Agricultural Cooperatives in Early Twentieth Century Spain. European Review of Economic History, 16 (4), 511-28.
Bijman, Jos et al. (2012). Support for Farmer’s Cooperatives: Final Report. Bruxelles: European Comission.
Bono, Paolo, Castillo, Juan & Iliopoulos, Constantine (2012). Case Study Report: Structure and Strategy of Wine Cooperatives. Wageningen: Wageningen UR.
Bossuat, Gérard (1992). L’Europe occidentale à l’heure américaine: Le Plan Marshall et l’unité européenne. Paris: Complexe.
Cadenas, Alfredo & Mújica, José Miguel (1983). Economía de la vitivinicultura española. Madrid: Instituto Nacional de Investigaciones Agrarias.
Cameron, Adrian Colin & Trivedi, Pravin K. (2010). Microeconometrics using Stata. 2nd ed. College Station: Stata Press.
Carrión, Pascual (1960). El viñedo y el vino en la provincia de Valencia. Valencia: Consejo Económico Sindical.
Carrión, Pascual (1973). Reforma agraria de la Segunda República. Barcelona: Ariel.
Chevet, Jean-Michel (2008). Cooperative Cellars and the Regrouping of the Supply in France in the Twentieth Century. In Yves Segers et al. (Ed.), Exploring the Food Chain (pp. 253-79). Turnhout: Brepols.
Christiansen, Thomas (2012). The Reason Why. Zaragoza: Prensas Universitarias de Zaragoza.
Clar, Ernesto, Martín-Retortillo, Miguel & Pinilla, Vicente (2018). The Spanish Path of Agrarian Change, 1950-2005. Journal of Agrarian Change, 18 (2), 324-47.
Cogega (2010). Agricultural Coopératives in Europe. Bruxelles: Cogega.
Commission des Communautés Européennes (1969). Conditions de commercialisation et formation des prix des vins de consommation courante. Bruxelles: Commission des Communautés Européennes.
Confédération Nationale des Coopératives Vinicoles (1976). Annuaire national des caves & distilleries coopératives. Paris: Confédération Nationale des Coopératives Vinicoles.
Corsi, Alessandro, Pomarici, Eugenio & Sardone, Roberta (2018). Italy from 1939. In Kym Anderson & Vicente Pinilla (Eds.), Wine Globalization: A New Comparative History (pp.153-77). Cambridge: Cambridge University Press.
Dirección General de Agricultura (1934). Censo estadístico de sindicatos agrícolas y comunidades de labradores. Madrid: Viuda de M. de Navarro.
Díaz, Marcelino (2009). Historia de la vid y el vino en Extremadura. In La agricultura y la ganadería extremeñas: Informe 2009 (pp. 263-78). Badajoz: Caja de Badajoz.
Díez Minguela, Alfonso, Martínez Galarraga, Julio & Tirado, Daniel (2018). Regional Inequality in Spain. Cham: Springer.
Delmastro, Marco (2005). An Investigation into the Quality of Wine: Evidence from Piedmont. Journal of Wine Research, 16 (1), 1-17.
Federico, Giovanni & Martinelli, Pablo (2018). Italy to 1938. In Kym Anderson & Vicente Pinilla (Eds.), Wine Globalization: A New Comparative History (pp. 130-52). Cambridge: Cambridge University Press.
Fernández, Eva (2012). Especialización en baja calidad: España y el mercado internacional del vino, 1950-1990. Historia Agraria, (56), 41-76.
Fernández, Eva (2014). Trust, Religion, and Cooperation in Western Agriculture, 1880-1930. Economic History Review, 67 (3), 678-98.
Fernández, Eva & Pinilla, Vicente (2018). Spain. In Kym Anderson & Vicente Pinilla (Eds.), Wine Globalization: A New Comparative History (pp. 208-38). Cambridge: Cambridge University Press.
Fernández, Eva & Simpson, James (2017). Product Quality or Market Regulation?: Explaining the Slow Growth of Europe’s Wine Cooperatives, 1880-1980. Economic History Review, 70 (1), 122-42.
Ferrer, Manuel (1957). Cooperativas del campo de Cariñena. Estudios Geográficos, (18), 429-55.
Fourneau, Maurice (1973). Le condado de Huelva, Bollullos, capitale du Vignoble. Mélanges de la Casa de Velázquez, (99), 7-80.
Gaeta, Davide & Corsinovi, Paola (2014). Economics, Governance, and Politics in the Wine Market: European Union Developments. New York: Palgrave McMillan.
Galtier, Gaston (1960). Le vignoble du Languedoc méditerranéen et du Roussillon. Montpellier: Graille & Castelnau.
Garrido, Samuel (2014). Plenty of Trust, not much Cooperation: Social Capital and Collective Action in Early Twentieth Century Spain. European Review of Economic History, 18 (4), 423-32.
Garrido, Samuel (2021). Inequality and Conflict as Drivers of Cooperation: The Location of Wine Cooperatives in pre-1936 Spain. Cliometrica, 15 (2), 443-76.
Garrido, Samuel (2022). Cooperatives, Opportunism and Quality Product: Why the Early Spanish Cooperative Wineries produced Ordinary Wine. Business History, 64 (1), 118-33.
Gangutia, Diego (2013). Cooperativa Santa Daría: 50º aniversario, 1963-2013. Cenicero: Bodega Santa Daría.
Gómez, José María (2003). Las cooperativas en el marco de las hermandades sindicales (Albacete, 1939-1959). Historia Agraria, (30), 151-82.
Hanf, Jon H. & Schweickert, Erik (2014). Cooperatives in the Balance between Retail and Member Interests: The Challenges of the German Cooperative Sector. Journal of Wine Research, 25 (1), 32-44.
Hansmann, Henry (1996). The Ownership of the Enterprise. Cambridge: Harvard University Press.
Henriksen, Ingrid, Hviid, Morten & Sharp, Paul (2012). Law and peace: Contracts and the success of the Danish dairy cooperatives. The Journal of Economic History, 72 (1), 197-224.
Instituto Nacional de Estadística (INE) (1920-70). Censo de la población de España. Madrid: INE.
Instituto Nacional de Estadística (INE) (1940-80). Anuario estadístico de España. Madrid: INE.
Instituto Nacional de Estadística (INE) (1966). Primer censo agrario de España, 1962. Madrid: INE.
Josling, Tim (2009) Western Europe. In Kym Anderson (Ed.), Distortions to Agricultural Incentives: A Global Perspective, 1955-2007 (pp. 115-76). Washington, DC: World Bank.
Langreo, Alicia & Castillo, Juan (2014). Estructura, organización y modelos empresariales en el sector. In Juan Sebastián Castillo & Raúl Compés (Coords.), La economía del vino en España y en el mundo (pp. 141-74). Almería: Cajamar.
Laporte, Jean Pierre & Lifran, Robert (1980). Eléments sur l’économie viti-vinicole espagnole. Montpellier: Institute National de la Recherche Agronomique.
Lachivier, Marcel (1988). Vins, vignes et vignerons. Paris: Fayard.
Loubère, Leo (1990). The Wine Revolution in France: The Twentieth Century. Princeton: Princeton University Press.
Martínez Carrión, José Miguel & Medina, Francisco (2010). Change and Development in the Spanish Wine Sector, 1950-2009. Journal of Wine Research 21 (1), 77-95.
Martínez Soto, Ángel P., Martínez Rodríguez, Susana & Méndez, Ildefonso (2012). Spain’s Development of Rural Credit Cooperatives from 1900 to 1936. European Review of Economic History, 16 (4), 449-68.
Medina, Francisco (2016). Intervención estatal del sector vitivinícola español durante el franquismo: Las bodegas cooperativas. In Noemí Girbal-Blacha et al. (Eds.), Agro y política a uno y otro lado del Atlántico (pp. 31-52). Buenos Aires: Imago Mundi.
Medina, Francisco & Planas, Jordi (2020). Las bodegas cooperativas y la comercialización del vino en España durante el siglo xx. Investigaciones de Historia Económica, (16), 23-34.
Medina, Francisco, Añón, Dolores, Díez-Minguela, Alfonso & Lana, José Miguel (2021). Old Wine in New Wineskins?: Understanding the Cooperative Movement: Catalonia, 1860-1939. European Review of Economic History, 25 (2), 328-54.
Meloni, Giulia & Swinnen, Johan (2013). The Political Economy of European Wine Regulations. Journal of Wine Economics, 8 (3), 224-84.
Meloni, Giulia, Anderson, Kym, Deconinck, Koen & Swinnen, Johan (2019). Wine Regulations. Applied Economic Perspectives and Policy, 41 (1), 620-49.
Ministère du Commerce (1908-15). Annuaire statistique de la France. Paris: Ministère du Commerce.
Ministerio de Agricultura (1930-2000). Anuario de Estadística Agraria. Madrid: Ministerio de Agricultura.
Morales, Alfredo (1976). La vid y el vino en la zona de Jumilla. Murcia: Academia Alfonso X.
Muruzabal, Jesús (2014). Centenario de la bodega cooperativa de San Martín de Unx. San Martín de Unx: Bodega Cooperativa San Martín de Unx.
O’Rourke, Kevin H. (2007). Property Rights, Politics and Innovation: Creamery Diffusion in pre-1914 Ireland. European Review of Economic History, 11 (3), 395-417.
Omer, Michel (1975). La situation actuelle du vignoble de Valdepeñas. Mélanges de la Casa de Velázquez, (11), 333-70.
Ostrom, Elinor (1990). Governing the Commons. New York: Cambridge University Press.
Pennerstorfer, Dieter & Weiss, Christoph. R. (2013). Product Quality in the Agri-Food Chain: Do Cooperatives offer High-Quality Wine? European Review of Agricultural Economics, 40 (1), 143-61.
Piqueras, Juan (2008). El sector vinícola español y la PAC. In Eduardo Araque et al. (Eds.), Las agriculturas españolas y la Política Agraria Comunitaria: Veinte años después (pp. 307-24). Jaén: Universidad Internacional de Andalucía.
Piqueras, Juan (2009). Campo Arcís, cooperativismo y viticultura: Del proceso de colonización agraria a la especialización vitícola, 1752-2009. Requena: Cooperativa San Isidro Labrador de Campo Arcís.
Planas, Jordi & Garrido, Samuel (2022). La protección del vi d’Alella abans de la denominació d’origen: El Sindicat Alella Vinícola. In Josep Colomé, Jordi Planas & Raimón Soler-Becerro (Eds.), Vins, aiguardents i caves: La comercialització de la producció vinícola catalana (segles xviii-xxi). Tarragona: Universitat Rovira i Virgili.
Planas, Jordi & Medina, Francisco (2017). Too little intervention or too much? The contribution of the State to the development of wine cooperatives in Spain. Revista de Historia Industrial, 26 (70), 77-107.
Planas, Jordi & Medina, Francisco (2022). Las cooperativas vinícolas bajo las dictaduras de Mussolini y Franco. Historia Social, (102), 143-61.
Roma, Paolo, Martino, Giuseppe & Perrone, Giovanni (2013). What to show on the Wine Labels: A Hedonic Analysis of Price Drivers of Sicilian Wines. Applied Economics, (45), 2765-78.
Saumell, Antoni (2002). Viticultura i associacionisme a Catalunya. Tarragona: Diputació de Tarragona.
Santos, Francisco J. & Schamel, Günter (2018). Organizational Form and Payoff Imbalances in an Aggrievement Model: Cooperatives versus Privately Owned Wineries. Journal of Wine Economics, 13 (3), 263-81.
Sanz Carnero, Francisco (1975). El viñedo español. Madrid: Ministerio de Agricultura.
Sanz Suescun, José M. (2010). Bodega cooperativa San Sebastián, Andosilla. Andosilla: Bodega San Sebastián.
Schamel, Günter (2014). Wine Quality, Reputation, Denominations: How Cooperatives and Private Wineries compete? BIO Web of Conferences, (3).
Schamel, Günter (2015). Can German Wine Cooperatives compete on Quality? BIO Web of Conferences, (5).
Simpson, James (2000). Cooperation and Cooperatives in Southern European Wine Production. Advances in Agricultural Economic History, (1), 95-126.
Spahni, Pierre (1988). The Common Wine Policy and Price Stabilization. Avebury: Gower.
Storchmann, Karl (2018). Introduction to the Issue: Wine Cooperatives. Journal of Wine Economics, 13 (3), 239-42.
Tamames, Ramón (1974). Estructura económica de España. Madrid: Guadiana.
Tirole, Jean (1996). A Theory of Collective Reputations. Review of Economic Studies, (63), 1-22.
Torrejón, Ángel (1923). Bodegas industriales. Madrid: Helénica.
Unión Nacional de Cooperativas del Campo (UNACO) (1944-78). Memoria. Madrid: UNACO.
Valette, Justine, Amadieu, Paul & Sentis, Patrick (2018). Cooperatives versus Corporations: Survival in the French Wine Industry. Journal of Wine Economics 13 (3), 328-54.
Warner, Charles (1960). The Winegrowers of France. New York: Columbia University Press.
Williams, Jeffrey C. & Wright, Brian, D. (1991). Storage and Commodity Markets. Cambridge: Cambridge University Press.
Wright, Briand D. (2001). Storage and Price Stabilization. In Handbook of Agricultural Economics (pp. 817-60). Vol. 1. Amsterdam: Elsevier.
APPENDIX
Appendix 1: Descriptive statistics for Table 2
Sources: (1) AGA, sig. 74, top. 35/50.501; (2) La Semana Vitivinícola, 13 July 1974, p. 3143; (3) AGA, (06)038.001, box 284, top. 35/50.303-51; (4) and (5) INE (1966); (6), (8), and (9) Ministerio de Agricultura (1943-71); (7) Ministerio de Agricultura (1962); (10) Dirección General de Agricultura (1934); (11) INE (1950); (12) UNACO (1944).
Appendix 2: Descriptive statistics for Table 3
| Obs. | Mean | Sth. Dev. | Min | Max | |
|---|---|---|---|---|---|
| (13) Cooperatives created, 1945-64 | 200 | 2.89 | 5.45 | 0.0 | 27.00 |
| (14) Cooperatives created, 1945-74 | 300 | 2.48 | 4.70 | 0.0 | 27.00 |
| (15)% of vineyard, 1945-64 | 200 | 6.67 | 6.91 | 0.78 | 37.32 |
| (16)% of vineyard, 1945-74 | 300 | 6.67 | 6.67 | 0.78 | 37.32 |
| (17)% drop in wine prices, 1945-64 | 200 | 30.78 | 22.64 | -31.90 | 67.24 |
| (18)% of illiteracy, 1945-64 | 200 | 18.62 | 11.43 | 2.5 | 48.00 |
| (19)% of illiteracy, 1945-74 | 300 | 16.15 | 10.91 | 2.0 | 48.00 |
| (20) Yields, 1945-64 | 200 | 16.41 | 11.28 | 2.76 | 60.13 |
| (21) Yields, 1945-74 | 300 | 18.20 | 13.02 | 2.76 | 85.84 |
| (22) GDP per capita, 1945-64 | 200 | 390.99 | 188.19 | 160.43 | 1048.60 |
| (23) GDP per capita, 1945-74 | 300 | 544.65 | 303.55 | 160.43 | 1515.77 |
Sources: (13) and (14) UNACO (1945-74); (15), (16), (17), (20), and (21) Ministerio de Agricultura (1945-54); (18) and (19) INE (1920-60); (22) and (23) Díez Minguela, Martínez Galarraga and Tirado (2018).
Appendix 3: Guaranteed prices and fraud
As already said, in 1953 it was decided that the guaranteed price would be equal to the costs of producing wine in La Mancha, which were lower than the Spanish average. However, probably as a result of political pressure, these costs were initially overestimated by the technicians of the Ministry of Agriculture, so that many winegrowers in La Mancha and in some areas with similar characteristics (Badajoz or the Valencian area of Requena-Utiel) found it profitable to sell wine to the state at the guaranteed price, instead of using the Commission only to avoid having heavy losses in years of high surpluses and falling prices33. The tendency in these areas was therefore to increase wine production without paying attention to market signals.
The guaranteed prices periodically rose, but to rectify the initial error they did so to a lesser extent than inflation. According to a report from the province of Ciudad Real, from 1963 onwards the guaranteed price evolved in the province as shown in Figure A1.
FIGURE A1
Real guaranteed price of wine in Ciudad Real (1963 = 100)
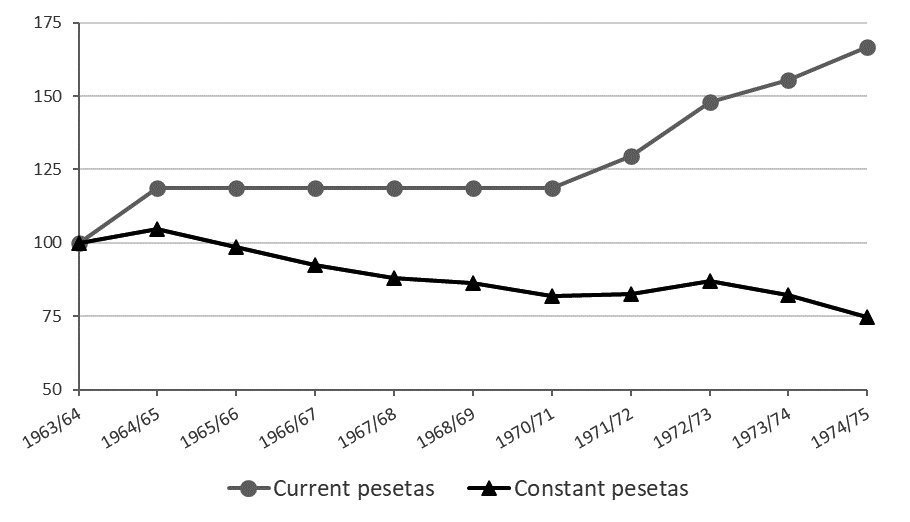
Source: AGA, (06)038.001, box 60 top. 35/50.303-51.301.
In order to keep their production costs below the guaranteed price in real terms, many winegrowers in La Mancha or Badajoz responded by making excessive use of chemicals and dispensing with operations (for instance, racking) that were necessary to obtain wines fit to be drunk. Initially the Commission did not take this into account and paid the guaranteed price for any wine it was offered, but in 1963-64 it was established that “drinkable” wine would be paid at 27 pesetas and wine that could not be used for anything except distillation was bought for 25 pesetas. As a result of this legitimization of cheating, the Commission received an avalanche of bad wine. From the following year onwards, it fixed bonuses or penalties according to quality and theoretically stopped accepting undrinkable wine. Over time, it progressively made the rules stricter but, with each tightening of the regulations, winemakers responded with a new malpractice. I will cite just one example.
Sulfur dioxide (SO2), also known as sulfites, is used during the winemaking process as an antioxidant and antimicrobial agent. If used in the right doses, the wine has a better color and aroma and less volatile acidity. The latter, which is basically caused by the presence of acetic acid, is always a “bad acidity”34: the more of it there is, the worse the wine will be, and above a certain threshold it will convey a distinctly unpleasant taste. As much of the wine purchased by the state had too much volatile acidity, from a certain point onwards it was established that, in order to qualify for the guaranteed price, the level of volatile acidity had to be less than one gram per liter of wine. To camouflage it, winemakers then used excessive amounts of sulfur dioxide, which tends to generate unpleasant aromas and can have harmful effects on the health of the consumer. When the state lowered the maximum permitted amount of sulfur dioxide, winemakers responded with another ruse, and so on, with the result that the wine bought by the Commission always had a horrible taste.
Despite selling large volumes of wine at what were in theory very low prices, in La Mancha or Badajoz vineyard surface area, yields and wine production increased. In 1976, when the cooperatives had a market share of only 11% in it, Badajoz destined more than half of the provincial wine harvest for distillation (Cadenas & Mújica, 1983: 30). Before the civil war of 1936-39, vineyards had had little presence in the province, but purchases at guaranteed prices acted as an incentive to plant vines, mainly by large landowners (Díaz, 2009: 273), and for them to use of high-yielding varieties that produced low-quality grapes. Thus, at the end of Franco’s regime Badajoz was already one of the “most wine-producing” provinces in Spain, because “the profitability of the vineyard, quality aside, [was] one of the highest in the country” (Sanz Carnero, 1975: 156).
↩︎ 1. Europapress Comunicados (2021/03/12). [accesed: 2022/09/14]
↩︎ 2. Although nobody doubts that there have always been cooperatives producing excellent wines. See Storchmann (2018), and Planas and Garrido (2022).
↩︎ 3. Without clarifying where they get the idea from or providing any figures, Allen and Lueck (2019) stated that European wine cooperatives began to flourish in the mid-nineteenth century and started to lose momentum a hundred years later. Their theoretical framework is used to explain why this occurred.
↩︎ 4. France was to some extent an exception, because before the Second World War there were already more than 800 cooperative wineries operating in France; but they produced only 16% of all French wine (see Table 1). Garrido (2021) analyzed why their market share was so low.
↩︎ 5. Cooperatives controlled quality with a rigor that was at least similar to that of non- cooperative wineries, but it should be made clear that by today’s standards it was a rather lax rigor.
↩︎ 6. But Valette, Amadieu and Sentis (2018) showed that French cooperative wineries have a longer average lifespan than non-cooperative wine businesses.
↩︎ 7. In 1951 the French Parliament rejected this option. On Portugal, Archivo General de la Administración (AGA), (06)038.001, box 51, top. 35/50.303-51.
↩︎ 8. Barciela (1985, 1989), who did not study the case of wine, which was analyzed by Christiansen (2012), authored several basic studies on Spanish agrarian policy under Franco.
↩︎ 9. Because of this fear, in the early days of the Marshall Plan, French wine lobbies joined a communist campaign against Coca-Cola ( Bossuat , 1992: 300).
↩︎ 10. As a complement to the cooperatives, in Spain the state used the so-called maquila wineries to produce wine in La Mancha under the direction of its civil servants, but they were of relatively little importance.
↩︎ 11. It had to “acquire on the market the wine stocks which, considered as surplus because they lacked buyers, were priced below cost” ( Tamames , 1974: 214).
↩︎ 12. Among other reasons, because due to the climatic conditions the vineyards of La Mancha did not need anti-cryptogamic treatments.
↩︎ 13. Twenty-five were founded, mainly gathering people “of weak economic position” ( Agricultura: Revista agropecuaria y ganadera , n. 271, 1954, p. 650).
↩︎ 14. In a campaign in 1956, 17 cooperatives were set up in Zaragoza, in Huelva 10 were founded in 1957, and in La Mancha there was a second campaign in 1958 (19 foundations) (UNACO, 1956: 32, 47; 1958: 69).
↩︎ 15. AGA, sig. 64, top. 35/50.401. Previously it was the Commission that decided how much wine to buy each campaign.
↩︎ 16. AGA, sig. 64, top. 35/50.401; (03)121.004, box 35/04883. In theory, the Commission was supposed to sell its wine when the price of wine in La Mancha was 10% above the guaranteed price, but since most of the wine it bought was of poor quality and at risk of going sour, it immediately converted it into alcohol, which it sold to Spanish wine exporters at below cost price.
↩︎ 17. Agricultura: Revista agropecuaria y ganadera , n. 437, 1967, p. 463.
↩︎ 18. According to Gaeta and Corsinovi (2014: 39), in the 1970s many winegrowers in the EEC were also involved in making “wine for distillation”. Bartoli (1984) showed that in some EEC regions, such as the French Midi , it could be more profitable to resort to a sequence of subsidized storage and distillation at cheap but guaranteed prices than to bring wine to the market.
↩︎ 19. In 1972, wine alcohol was sold on the market at an average of 73 pesetas/liter and the state paid 38 pesetas for it ( Tamames , 1974: 221).
↩︎ 20. In 1967 there were 680 large, 1,368 medium and 7,538 small companies in Spain that only produced table wine, compared to 39 large, 85 medium and 300 small companies that were exclusively or partially dedicated to producing or exporting quality wine (AGA, sig. 64, top. 35/50.401).
↩︎ 21. Technicians such as Torrejón (1923) strongly advised them to do so, because several of the cooperatives that had attempted to produce quality wine ended up going bankrupt ( Lachivier , 1988: 488).
↩︎ 22. An official report from 1967 stated that 30% of the “industrial” wineries, 75% of the “private” ones and only 18% of the cooperatives needed to renew their equipment because it was obsolete or deteriorated (AGA, sig. 64, top. 35/50.401).
↩︎ 23. AGA, (06)038.001, box 284, top. 35/50.303-51.
↩︎ 24. Ciudad Real, in La Mancha, was the largest wine-producing province in Spain and in 1966-67 it was the one that sold the most wine to the Commission (Fig. 6). In the previous campaign, Spain distilled 13% of its wine while the figure for Ciudad Real was 55% ( Organización Sindical Ciudad Real , 1968: 16).
↩︎ 25. Although some produced both “drinkable” and “undrinkable” wine ( Fourneau , 1973).
↩︎ 26. As in 1964-65 the Commission did not have funds available to buy wine at the guaranteed price until very late, many winegrowers were obliged ‘to put their products on the market, causing the natural drop in prices’ ( Cadenas & Mújica , 1983:17). According to UNACO (1965: 42), that year the La Mancha cooperatives sold their wine at an average of 31.50 pesetas per hectoliter and degree of alcohol, when the guaranteed price was fixed at 32 pesetas.
↩︎ 27. As those grapes were paid for immediately, they were often sold for a price that was lower than the one, months later, the cooperatives would pay for the grapes that were handed over to them ( Morales , 1976). But during those months members who did not sell grapes on the market often borrowed and repaid loans.
↩︎ 28. In the 1971-72 season, cooperatives accounted for just over half of Spanish wine (Fig. 2), but their provincial market shares ranged from 83.5% to 0% (mean, 32%; coefficient of variation, 83%).
↩︎ 29. AGA, sig. 74, top. 35/50.501. Traditionally, official statistics on wine production indicated lower figures than the real ones, so that in some provinces the cooperatives had overestimated market shares (sometimes more than 100%).
↩︎ 30. After using a Poisson model and finding over-dispersion, I replaced it with a negative binomial regression (NBREG). In turn, Vuong tests suggested that a standard NBREG was preferable to one with zero inflation.
↩︎ 31. As is usual in cliometric studies on Spanish agricultural cooperatives ( Beltrán , 2012; Garrido , 2014, 2022; Medina et al., 2021), when I used the commons as a proxy for social capital, the sign remained positive, but the statistical significance disappeared.
↩︎ 32. It had been common for merchants to make wine from their own grapes and those bought from small farmers. Often, when merchants joined the cooperatives, those farmers were forced to do so as well, because the cooperative became the only buyer of grapes within a reasonable distance. Around 1900, Danish dairy cooperatives had undergone a process with certain similarities ( Henriksen, Hviid & Sharp , 2012).
↩︎ 33. This is what is stated in an official report preserved in AGA, sig. 64, top. 35/50.401.
↩︎ 34. Whereas the fixed acidity is what we might call the good acidity –provided it stays within a range.